Web Server Statistics for learning.juanosorio.dev

Program started on Fri, Oct 23 2026 at 7:02 AM.
Analyzed requests from Sat, Oct 03 2026 at 8:25 AM to Fri, Oct 23 2026 at 7:01 AM (19.94 days).

General Summary

(Go To: Top | General Summary | Monthly Report | Daily Summary | Hourly Summary | Domain Report | Organization Report | Failed Referrer Report | Referring Site Report | Browser Report | Browser Summary | Operating System Report | Status Code Report | File Size Report | File Type Report | Directory Report | Request Report)
Figures in parentheses refer to the 7-day period ending Oct 23 2026 at 7:02 AM.

Successful requests: 65,833 (36,276)
Average successful requests per day: 3,301 (5,182)
Successful requests for pages: 37,380 (8,718)
Average successful requests for pages per day: 1,874 (1,245)
Failed requests: 5,978 (3,923)
Redirected requests: 105 (72)
Distinct files requested: 35,794 (36,664)
Distinct hosts served: 66 (116)
Data transferred: 7.50 gigabytes (7.42 gigabytes)
Average data transferred per day: 385.16 megabytes (1.06 gigabytes)

Monthly Report

(Go To: Top | General Summary | Monthly Report | Daily Summary | Hourly Summary | Domain Report | Organization Report | Failed Referrer Report | Referring Site Report | Browser Report | Browser Summary | Operating System Report | Status Code Report | File Size Report | File Type Report | Directory Report | Request Report)

Each unit (+) represents 1,000 requests for pages or part thereof.

month#reqs#pages 
Oct 20266583337380++++++++++++++++++++++++++++++++++++++

Busiest month: Oct 2026 (37,380 requests for pages).

Daily Summary

(Go To: Top | General Summary | Monthly Report | Daily Summary | Hourly Summary | Domain Report | Organization Report | Failed Referrer Report | Referring Site Report | Browser Report | Browser Summary | Operating System Report | Status Code Report | File Size Report | File Type Report | Directory Report | Request Report)

Each unit (+) represents 500 requests for pages or part thereof.

day#reqs#pages 
Sun4211+
Mon434+
Tue10242+
Wed3913+
Thu3598820669++++++++++++++++++++++++++++++++++++++++++
Fri2958416635++++++++++++++++++++++++++++++++++
Sat356+

Hourly Summary

(Go To: Top | General Summary | Monthly Report | Daily Summary | Hourly Summary | Domain Report | Organization Report | Failed Referrer Report | Referring Site Report | Browser Report | Browser Summary | Operating System Report | Status Code Report | File Size Report | File Type Report | Directory Report | Request Report)

Each unit (+) represents 500 requests for pages or part thereof.

hour#reqs#pages 
01112211116+++++++++++++++++++++++
1114+
23912+
3132970+
4536269+
53342818++
6132574362+++++++++
730
8211+
91111+
1052+
11221+
1242+
1374+
14251+
1521+
1660
17221+
1811+
1999+
206013+
2100
22423894+
233176120588++++++++++++++++++++++++++++++++++++++++++

Domain Report

(Go To: Top | General Summary | Monthly Report | Daily Summary | Hourly Summary | Domain Report | Organization Report | Failed Referrer Report | Referring Site Report | Browser Report | Browser Summary | Operating System Report | Status Code Report | File Size Report | File Type Report | Directory Report | Request Report)

Listing domains, sorted by the amount of traffic.

#reqs%bytesdomain
65833100%[unresolved numerical addresses]

Organization Report

(Go To: Top | General Summary | Monthly Report | Daily Summary | Hourly Summary | Domain Report | Organization Report | Failed Referrer Report | Referring Site Report | Browser Report | Browser Summary | Operating System Report | Status Code Report | File Size Report | File Type Report | Directory Report | Request Report)

Listing the top 20 organizations by the number of requests, sorted by the number of requests.

#reqs%bytesorganization
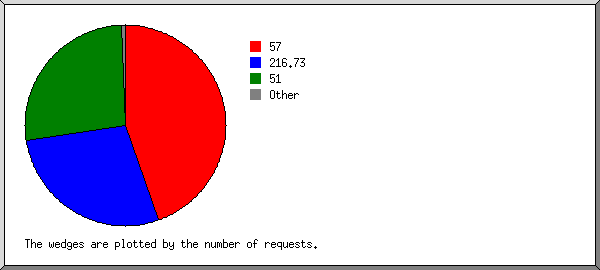
29336 0.84%57
1843865.29%216.73
1771533.68%51
160 10
39 0.05%82
24 0.01%152.32
18 66.132
10 104
9 0.01%85
8 0.01%185.103
8 20
6 185.191
6 0.01%109
6 0.01%209.38
5 0.01%38
5 167.99
5 208.84
5 159.89
4 185.177
3 0.01%143.244
23 0.08%[not listed: 16 organizations]

Failed Referrer Report

(Go To: Top | General Summary | Monthly Report | Daily Summary | Hourly Summary | Domain Report | Organization Report | Failed Referrer Report | Referring Site Report | Browser Report | Browser Summary | Operating System Report | Status Code Report | File Size Report | File Type Report | Directory Report | Request Report)

Listing referring URLs, sorted by the number of failed requests.

#reqsURL
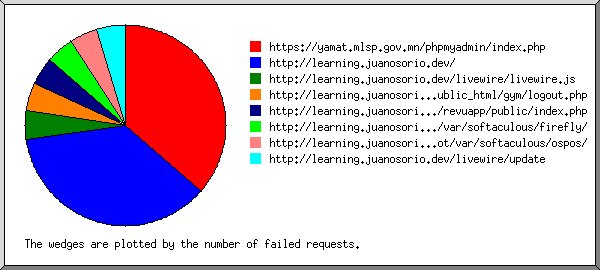
8https://yamat.mlsp.gov.mn/phpmyadmin/index.php
8http://learning.juanosorio.dev/
1http://learning.juanosorio.dev/livewire/livewire.js
1http://learning.juanosorio.dev/1337_DATA/alfasymlink/root/home/josoriodev/public_html/gym/logout.php
1http://learning.juanosorio.dev/1337_DATA/alfasymlink/root/home/josoriodev/public_html/revuapp/public/index.php
1http://learning.juanosorio.dev/1337_DATA/alfasymlink/root/var/softaculous/firefly/
1http://learning.juanosorio.dev/1337_DATA/alfasymlink/root/var/softaculous/ospos/
1http://learning.juanosorio.dev/livewire/update

Referring Site Report

(Go To: Top | General Summary | Monthly Report | Daily Summary | Hourly Summary | Domain Report | Organization Report | Failed Referrer Report | Referring Site Report | Browser Report | Browser Summary | Operating System Report | Status Code Report | File Size Report | File Type Report | Directory Report | Request Report)

Listing referring sites, sorted by the number of requests.

#reqssite
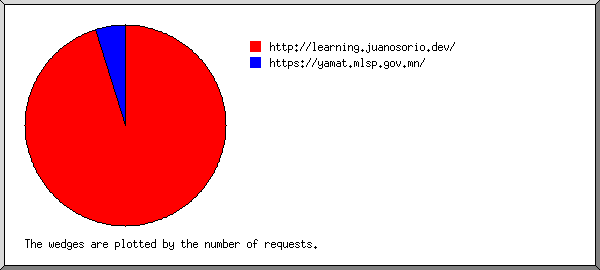
79http://learning.juanosorio.dev/
4https://yamat.mlsp.gov.mn/

Browser Report

(Go To: Top | General Summary | Monthly Report | Daily Summary | Hourly Summary | Domain Report | Organization Report | Failed Referrer Report | Referring Site Report | Browser Report | Browser Summary | Operating System Report | Status Code Report | File Size Report | File Type Report | Directory Report | Request Report)

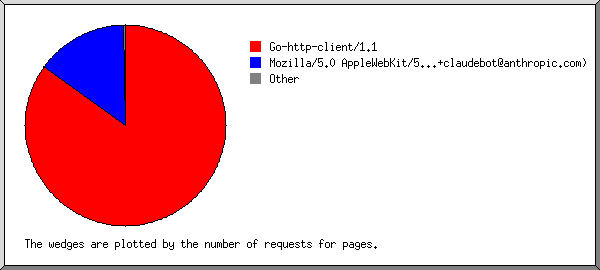
Listing browsers with at least 1 request for a page, sorted by the number of requests for pages.

#reqs#pagesbrowser
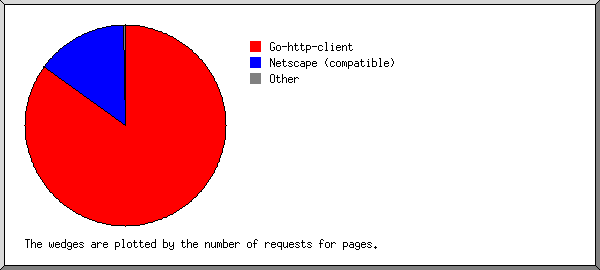
4705131758Go-http-client/1.1
184385511Mozilla/5.0 AppleWebKit/537.36 (KHTML, like Gecko; compatible; ClaudeBot/1.0; +claudebot@anthropic.com)
2323Mozilla/5.0 (Macintosh; Intel Mac OS X 10_7_0) AppleWebKit/535.11 (KHTML, like Gecko) Chrome/17.0.963.56 Safari/535.11
1818Mozilla/5.0 (compatible; CensysInspect/1.1; +https://about.censys.io/)
1612Mozilla/5.0 (l9scan/2.0.937313e243e2534313e2638313; +https://leakix.net)
1212Mozilla/5.0 (compatible; SemrushBot/7~bl; +http://www.semrush.com/bot.html)
307Mozilla/5.0 (Windows NT 10.0; Win64; x64) AppleWebKit/537.36 (KHTML, like Gecko) Chrome/106.0.0.0 Safari/537.36
66Mozilla/5.0 (Windows NT 10.0; Win64; x64) AppleWebKit/537.36 (KHTML, like Gecko) Chrome/78.0.3904.108 Safari/537.36
54Mozilla/5.0 (Windows NT 10.0; Win64; x64) AppleWebKit/537.36 (KHTML, like Gecko) Chrome/143.0.0.0 Safari/537.36
44Hello from Palo Alto Networks, find out more about our scans in https://docs-cortex.paloaltonetworks.com/r/1/Cortex-Xpanse/Scanning-activity
63Mozilla/5.0 (compatible; MSIE 10.0; Windows NT 6.3; Trident/6.0)
63Mozilla/5.0 (X11; Ubuntu; Linux i686 on x86_64; rv:46.0) Gecko/20100101 Firefox/46.0
22Mozilla/5.0 (X11; Linux x86_64) AppleWebKit/537.36 (KHTML, like Gecko) Chrome/153.0.0.0 Safari/537.36
32Mozilla/5.0 (Windows NT 10.0; Win64; x64) AppleWebKit/537.36 (KHTML, like Gecko) Chrome/58.0.3029.110 Safari/537.3
42python-requests/2.32.5
11Mozilla/5.0 (Macintosh; Intel Mac OS X 10_15_7) AppleWebKit/537.36 (KHTML, like Gecko) Chrome/106.0.0.0 Safari/537.36
21Mozilla/5.0 (X11; Ubuntu; Linux i686 on x86_64) AppleWebKit/537.36 (KHTML, like Gecko) Chrome/49.0.2629.64 Safari/537.36
11Mozilla/5.0 (compatible; NetcraftSurveyAgent/1.0; +info@netcraft.com)
21Mozilla/5.0 (X11; Linux i686; rv:48.0) Gecko/20100101 Firefox/48.0
11Mozilla/5.0 (Windows NT 10.0; Win64; x64) AppleWebKit/537.36 (KHTML, like Gecko) Chrome/83.0.4093.0 Safari/537.36 Edg/83.0.470.0
21Mozilla/5.0 (Windows NT 5.1; rv:50.0) Gecko/20100101 Firefox/50.0
11Mozilla/5.0 (Macintosh; Intel Mac OS X 10_15_7) AppleWebKit/537.36 (KHTML, like Gecko) Chrome/105.0.0.0 Safari/537.36
11Mozilla/5.0 (Windows NT 10.0; Win64; x64) AppleWebKit/537.36 (KHTML, like Gecko) Chrome/105.0.0.0 Safari/537.36
11Mozilla/5.0 (Macintosh; Intel Mac OS X 10_15_7) AppleWebKit/537.36 (KHTML, like Gecko) Chrome/120.0.0.0 Safari/537.36 Edg/120.0.0.0
11curl/8.3.0
11Mozilla/5.0 (Windows NT 10.0; Win64; x64) AppleWebKit/537.36 (KHTML, like Gecko) Chrome/116.0.0.0 Safari/537.36
11Mozilla/5.0 (X11; Linux i686 on x86_64; rv:49.0) Gecko/20100101 Firefox/49.0
21Mozilla/5.0 (Windows NT 10.0; Win64; x64) AppleWebKit/537.36 (KHTML, like Gecko) Chrome/127.0.0.0 Safari/537.36
1840[not listed: 20 browsers]

Browser Summary

(Go To: Top | General Summary | Monthly Report | Daily Summary | Hourly Summary | Domain Report | Organization Report | Failed Referrer Report | Referring Site Report | Browser Report | Browser Summary | Operating System Report | Status Code Report | File Size Report | File Type Report | Directory Report | Request Report)

Listing browsers with at least 1 request for a page, sorted by the number of requests for pages.

##reqs#pagesbrowser
14705131758Go-http-client
 4705131758  Go-http-client/1
2184705542Netscape (compatible)
39652Safari
 7029  Safari/537
 2323  Safari/535
41612Mozilla
5176Firefox
 63  Firefox/46
 21  Firefox/50
 21  Firefox/48
 11  Firefox/49
644Hello from Palo Alto Networks, find out more about our scans in https:
 44  Hello from Palo Alto Networks, find out more about our scans in https://docs-cortex
763MSIE
 63  MSIE/10
842python-requests
 42  python-requests/2
911curl
 11  curl/8
 1600[not listed: 1 browser]

Operating System Report

(Go To: Top | General Summary | Monthly Report | Daily Summary | Hourly Summary | Domain Report | Organization Report | Failed Referrer Report | Referring Site Report | Browser Report | Browser Summary | Operating System Report | Status Code Report | File Size Report | File Type Report | Directory Report | Request Report)

Listing operating systems, sorted by the number of requests for pages.

##reqs#pagesOS
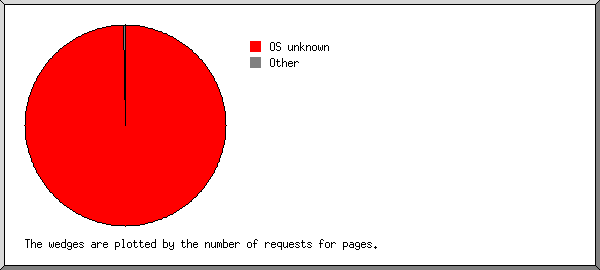
16570537319OS unknown
26727Windows
 5823  Windows NT
 73  Unknown Windows
 21  Windows XP
33526Macintosh
4178Unix
 178  Linux
510Known robots

Status Code Report

(Go To: Top | General Summary | Monthly Report | Daily Summary | Hourly Summary | Domain Report | Organization Report | Failed Referrer Report | Referring Site Report | Browser Report | Browser Summary | Operating System Report | Status Code Report | File Size Report | File Type Report | Directory Report | Request Report)

Listing status codes, sorted numerically.

#reqsstatus code
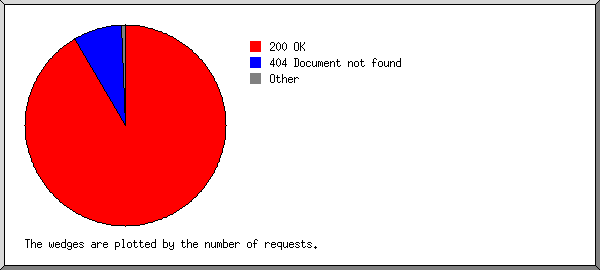
65833200 OK
45301 Document moved permanently
60302 Document found elsewhere
5400 Bad request
5403 Access forbidden
5689404 Document not found
9405 Method not allowed
2409 Request conflicts with state of resource
266500 Internal server error
2503 Service temporarily unavailable

File Size Report

(Go To: Top | General Summary | Monthly Report | Daily Summary | Hourly Summary | Domain Report | Organization Report | Failed Referrer Report | Referring Site Report | Browser Report | Browser Summary | Operating System Report | Status Code Report | File Size Report | File Type Report | Directory Report | Request Report)

size#reqs%bytes
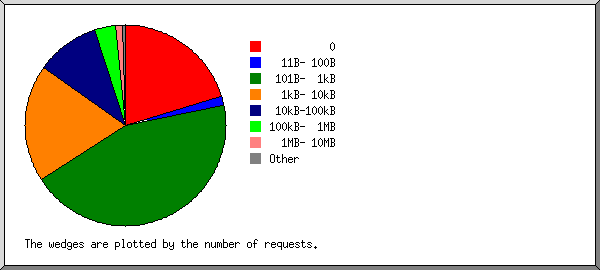
013426 
1B- 10B126 
11B- 100B926 
101B- 1kB28975 0.26%
1kB- 10kB12491 0.50%
10kB-100kB6723 3.14%
100kB- 1MB2337 8.52%
1MB- 10MB74527.66%
10MB-100MB6415.29%
100MB- 1GB2044.63%

File Type Report

(Go To: Top | General Summary | Monthly Report | Daily Summary | Hourly Summary | Domain Report | Organization Report | Failed Referrer Report | Referring Site Report | Browser Report | Browser Summary | Operating System Report | Status Code Report | File Size Report | File Type Report | Directory Report | Request Report)

Listing extensions with at least 0.1% of the traffic, sorted by the amount of traffic.

#reqs%bytesextension
1459743.22%[no extension]
3024.27%.zip [Zip archives]
1610.59%.msi
610 3.34%.0
164 3.16%.ucode
868 1.45%.so
291 0.94%.1
81 0.92%.log
90 0.88%.3
37257 0.87%[directories]
7 0.80%.exe [Executables]
12 0.79%.60
167 0.72%.2
1816 0.66%.json
587 0.50%.js [JavaScript code]
29 0.44%.x86_64
322 0.39%.bin
443 0.38%.jpg [JPEG graphics]
84 0.33%.7
128 0.29%.6
28 0.24%.9
57 0.23%.4
4 0.23%.31
2 0.22%.pwd
1 0.20%.27
61 0.18%.ttf
51 0.15%.5
5 0.15%.32
554 0.14%.css [Cascading Style Sheets]
17 0.13%.sql
358 0.13%.png [PNG graphics]
869 0.13%.gz [Gzip compressed files]
6 0.12%.gold
6 0.12%.15
15 0.11%.8
368 0.11%.py
5 0.10%.22
5827 2.37%[not listed: 255 extensions]

Directory Report

(Go To: Top | General Summary | Monthly Report | Daily Summary | Hourly Summary | Domain Report | Organization Report | Failed Referrer Report | Referring Site Report | Browser Report | Browser Summary | Operating System Report | Status Code Report | File Size Report | File Type Report | Directory Report | Request Report)

Listing directories with at least 0.01% of the traffic, sorted by the amount of traffic.

#reqs%bytesdirectory
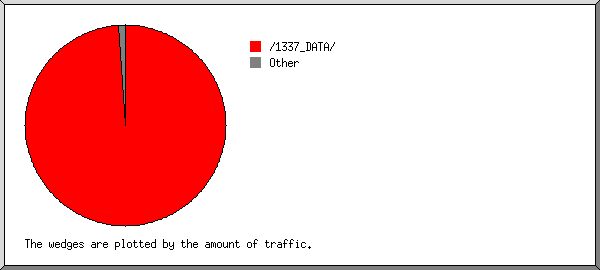
3615798.97%/1337_DATA/
10099 0.67%/storage/
18731 0.21%/well-known/
148 0.10%[root directory]
24 0.02%/front/
674 0.03%[not listed: 23 directories]

Request Report

(Go To: Top | General Summary | Monthly Report | Daily Summary | Hourly Summary | Domain Report | Organization Report | Failed Referrer Report | Referring Site Report | Browser Report | Browser Summary | Operating System Report | Status Code Report | File Size Report | File Type Report | Directory Report | Request Report)

Listing files with at least 20 requests, sorted by the number of requests.

#reqs%byteslast timefile
83 0.03%Oct/23/26 5:45 AM/1337_DATA/alfasymlink/root/home/josoriodev/public_html/wpxml.php
35 0.02%Oct/23/26 5:44 AM  /1337_DATA/alfasymlink/root/home/josoriodev/public_html/wpxml.php?path=/home/josoriodev&msg=Deleted
17 Oct/23/26 5:45 AM  /1337_DATA/alfasymlink/root/home/josoriodev/public_html/wpxml.php?path=/home&msg=Deleted
69 0.07%Oct/23/26 3:34 AM/
6568199.89%Oct/23/26 6:58 AM[not listed: 33,532 files]